Blog
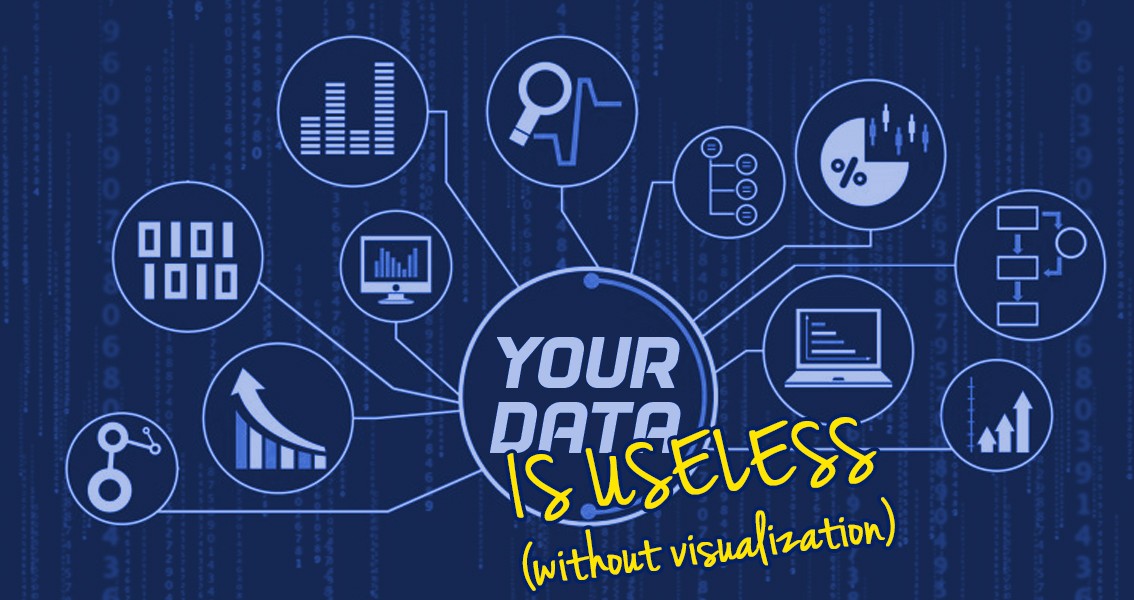
Your Data is Useless (without Visualization)
January 18, 2016
Posted by: Michael Woolf
Howard Baldwin, the community editor for Data Driven Business at Forbes asks the question in a recent post, “How much is data worth?” He posits that those companies that are built on data seem to show an offset between their “actual market valuation” and their “market valuation.” The gap, he suggests, is filled by the goodwill created by the value of data.
Baldwin references a report compiled from a survey incorporating results from more than 1,000 C-suite and senior decision makers and noted three key takeaways:
• Data Drives Revenue – the idea is that big data is a driver of revenues of its own accord and is, thus, becoming as valuable an asset to their businesses as their existing products and services (61% of respondents agree).
• Exploiting Data will Lead to Increased Revenues – a number of companies surveyed are exploiting (or are reorganizing to exploit) big data opportunities (43% of respondents)
• Data Investments are the Future – over the next few years, big data investments by the respondent companies will outstrip past investment (54% of respondents).
All of this begs the question: Is the data the real driver of revenues here?
On the surface, one can surely look to the Facebooks, Googles, and Ubers of the world and see a massive amount of their revenues being driven by the collection and analysis of data. We are deep into the Information Age, aren’t we? So that really should come as little surprise to anyone who has been paying attention to the strong trend toward data-driven business modeling in recent years.
Baldwin further asks whether “people are going to get a little peeved about companies making money off of information that they’ve generated?” Sure, and why shouldn’t they. When done wrong, companies stockpiling and analyzing data about our habits and process is a little big-brother troubling – whether we agree to the Terms of Service or not. (For more, check out New York Times reporter Charles Duhigg’s fantastic video about Target’s use of the data they collect about you here.)
To my mind, the question I think must be posed is: Are these revenues being driven by the collection and analysis of the data itself or rather are they made by the conversion of raw data into useful tools from which customers can derive real value? Is it the data or what the customer can do with your data that matters?
The thought that “exploitation” of data as a product/service equates to revenue is, I imagine, why many of these companies are moving toward a data-as-product mentality.* And all of that data is great – but the sheer volume of data that we are bombarded with daily is nearly impossible for us to digest without the one key ingredient that the Facebooks, Googles, and Ubers have all gotten right – the visualization of the data.
Data visualization is far more than just presentation of data in a graph, but rather the conveyance of information in a universally (and near-instantly accessible/digestible) manner. It is a way to simplify processing of information in a visual way. Data visualization starts with data analysis and the logical and inspired creation of algorithms, but it doesn’t end there. These algorithms must be designed alongside great visualization tools to help convey the data so that it can be easily understood, instantly clarifying and simplifying the data and providing the ability to see its relationship to the context of the matter at hand.
I have come to believe that we are rapidly moving out of the Information (READ: Data) Age and into the Visualization Age. David McCandless in his TED talk (TEDGlobal 2010) said, “There's something almost quite magical about visual information. It's effortless, it literally pours in. And if you're navigating a dense information jungle, coming across a beautiful graphic or a lovely data visualization, it's a relief, it's like coming across a clearing in the jungle.”
Data visualization is not about making a pretty chart or graph, however, it’s far more than that. McCandless suggests that, by visualizing information it is turned “into a landscape that you can explore with your eyes, a kind of map, really, a sort of information map. And when you're lost in information, an information map is kind of useful.”
With that slight change in perspective, I contend that the Facebooks, Googles, and Ubers don’t create their value by the collection and analysis of the data, but by their ability to convert the data into digestible data – visualized data – that we can instantly, and at a glance use to help improve our own processes, efficiency, workflow, or daily routines.
That, to my mind, the true value proposition to a company is not in their data, itself, but rather in their ability to offer the data in a way that a user can digest the data at a glance. A company’s data is only as valuable as what its customer can do with the data.
Do you agree?
-------
* We see this type of bandwagon-jumping/copycat behavior all the time. The (mis)belief that you can just look at a successful product or service, clone it, and then you'll be successful is not a new phenomenon. Unfortunately, it is most often met with much less success, because the copycat usually misses the core element that made the successful version a success. How many unsuccessful activity trackers (since Fitbit), yogurt or cupcake shops, movies (Wyatt Earp vs. Tombstone, Allan Quartermain v. Indiana Jones, Deep Impact v. Armaggedon), or “Uberized” services do we need to observe to see this trend?
